In a previous blog post, we explained the use of mobile apps during the pandemic to fight COVID-19, which led us to look at how our customers are leveraging Info Grove to engage with their audience during the pandemic. We were ecstatic to see that some of our customers have used Info Grove’s flexibility and have created COVID-19 specific content in their apps to keep their communities informed. Even more rewarding, were the statistics we saw through the analytics tool which indicated increased engagement since the start of the pandemic.
Municipalities
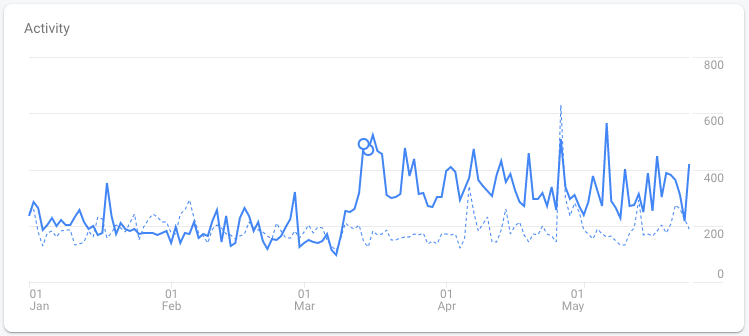
For Municipalities, the coronavirus pandemic has been especially rocky with information constantly changing and cities and towns having to adjust to federal, regional and local guidelines, affecting the residents and businesses in the community. Some of our municipal customers have decided to make use of their mobile apps to keep their communities updated and informed. In the first screenshot below, the solid blue line shows a clear change in daily audience engagement that is jumping from an average daily activity of around 200 users to around 350 users per day.
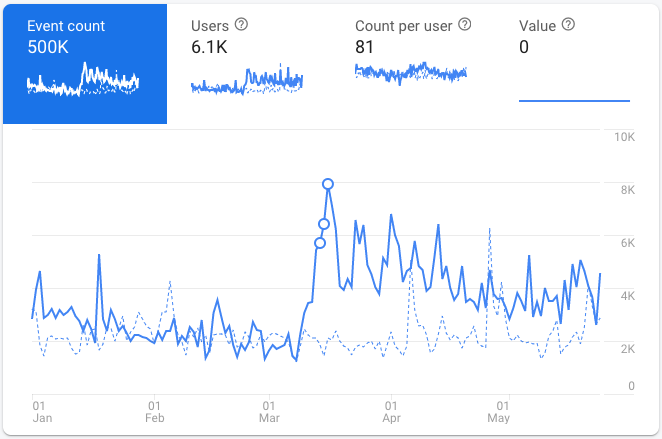
Correlating with the number of daily users, the next screenshot below shows the number of events (in-app pages visited or actions done) spiking in early March elevating a daily event average from around 2,000 events to around 6,000 and decreasing to around 4,000 at the start of May. This means that not only are there more users on the app but there is also more interaction per user with about 10 events per user before March to around 15 events per user during March and April.
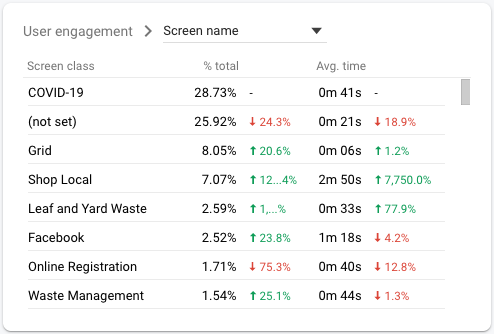
Finally, we looked at what screens the users were looking at to make sure the numbers we are seeing were indeed due to the Coronavirus and not something else. The last municipal screenshot below shows that from March 1st, 28.73% of the in-app time is spent on COVID-19 related information.
Associations and Unions
We thought it made sense that municipalities have this level of engagement with their app users due to the implication of the pandemic, but how did it affect our membership-based organization customers such as associations and unions.
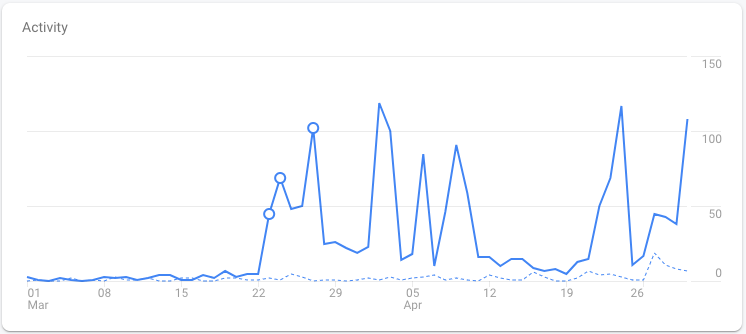
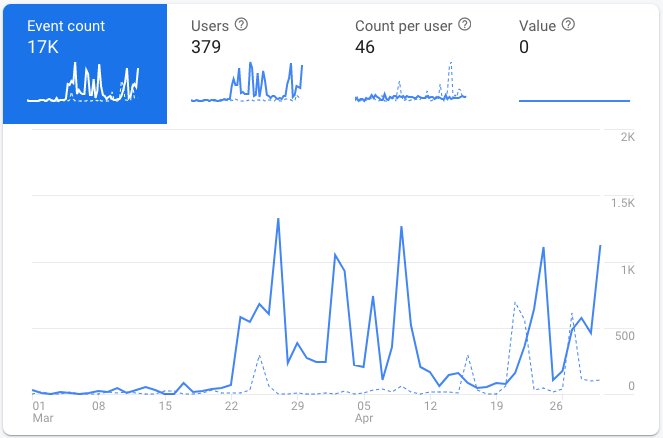
Looking at the same data, in the below example we can see a clear increase in daily user activity with some days well over 100 users per day with a minimum average of between 10 and 25 users per day.
Looking at the events for this example, we can also see that the increase in events correlates with the increased daily user activity with an almost identical graph below for the period of March 1st to April 30th.
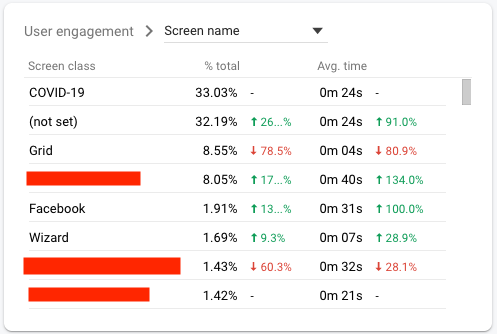
To make sure that this increase is once again influenced by COVID-19, we had a look at the different events and time spent on what type of content. In the screenshot below we can see that the members of this association have spent 33.03% of their time on the COVID-19 related content, which is the highest percentage in the list (we have omitted some screens names for our customer’s privacy).
By looking at these numbers, we can clearly see that organizations can maintain and even increase engagement during a time of crisis. A mobile app is convenient and allows users to receive relevant and timely notification and information wherever they are. Through a simple push notification letting residents know which parks and services are opening up again or the time of your association’s next zoom meeting, a mobile app will deliver the message to your users.
We couldn’t be more excited that Info Grove is helping our customers reach their communication goals and augment engagement levels. If you are looking to launch an app for your municipality or association, you can contact us and we would be happy to help you.
Increased App Engagement During COVID-19
Share This Article